
REALTY FORTE GOALS METHOD CASE STUDY · NORTH CAROLINA BROKERAGE
$2.5 million + in GCI from less than $22k in ad spend
How Coldwell Banker Howard Perry and Walston used the GOALS Method—ARIA, Local Search Dominance, and LSA build & management—to strengthen local discovery, increase reported profile actions, and build clearer paid-search visibility.
+114% Website leads
+145% Phone calls
255 LSA leads
Verified local impact · 12-month performance analysis · Zero ad waste

THE GOALS METHOD
One brokerage growth system.
01 · ARIA
Visibility, reputation, answer-engine readiness, and reporting support.
02 · LOCAL SEARCH DOMINANCE
Expert-managed local visibility, authority, and ongoing execution.
03 · LSA BUILD & MANAGEMENT
Paid local discovery with measurable lead delivery and placement data.
18,082 — Search views — +71% reported
4,091 — Maps views — +180% reported
233 — Phone calls — +145% reported
1,162 — Website clicks — +114% reported
The business challenge
In local real estate, being easy to find is only the first step.
Prospective buyers and sellers often encounter a brokerage first in Search, Maps, a Local Services Ad, or an AI-assisted answer. The opportunity is not just to appear - it is to make it easier for the right person to understand the business, take the next step, and start a conversation.
For Coldwell Banker Howard Perry and Walston, the GOALS Method connected ARIA, Local Search Dominance, and paid Local Services Ads. The reporting shows a more measurable path from visibility to inbound opportunity.
GOALS Method · Local Search Dominance
Local visibility translated into
more significant actions.
The Local Search Dominance layer of the GOALS Method shows gains in the ways people saw and interacted with this brokerage’s Google presence. These are report-level performance comparisons - not closed-client or revenue attribution.
SOURCE WINDOW
Oct 8, 2025 - Oct 8, 2026
What this means for a brokerage
More reported calls, website clicks, and direction requests create more opportunities for a prepared team to respond to prospective buyers and sellers. Actual lead quality, conversion, and revenue depend on many factors outside this report.
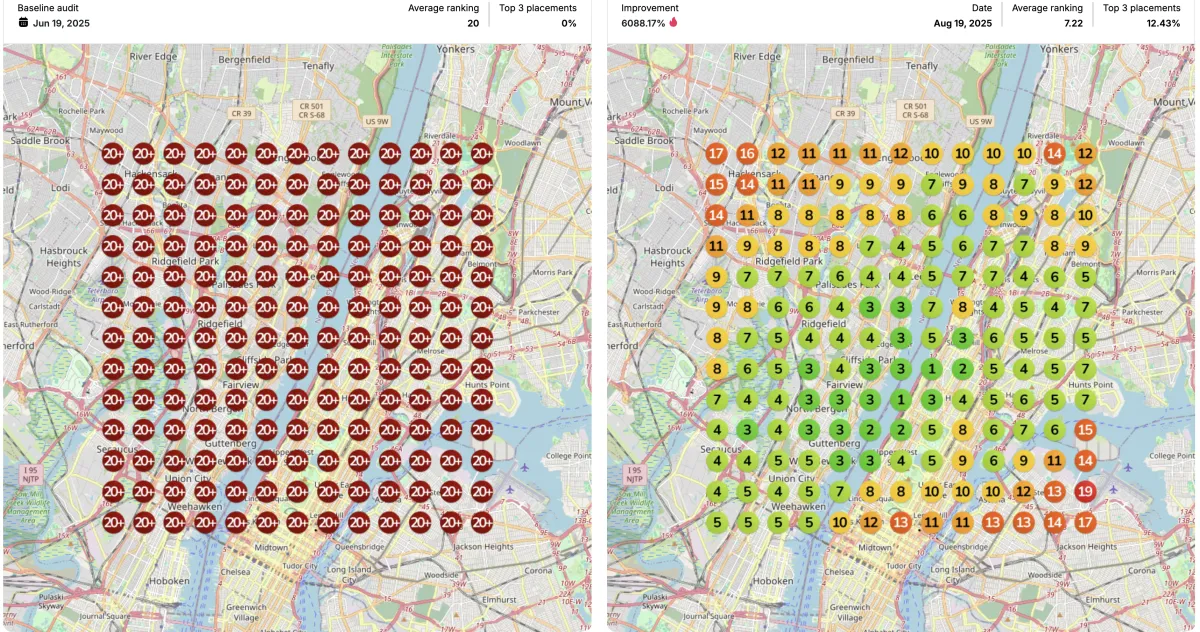
Conceptual illustration of the geographic variation tracked in a heat-map audit. It is not the underlying ranking grid.
GOALS Method · Heat-map ranking movement
Progress across the searchesbuyers and sellers actually use.
The Local Search report’s heat-map audit recorded an average ranking change from 19.4 at baseline to 17.4 at the latest audit - reported as a 10.2% change. The strongest positive keyword snapshots are below.
HEAT-MAP AUDIT SNAPSHOT · BASELINE NOV 13, 2025 → LATEST OCT 11, 2026
Reported heat-map improvement
1,985.21%
“first time home buyer agents”
Reported heat-map improvement
953.39%
“best real estate agency near me”
Reported heat-map improvement
737.7%
“best listing agents near me”
Improvement percentages and rank/placement figures above are reported values from the supplied heat-map audit. Local rankings can vary by query, searcher location, competition, proximity, and platform changes.
GOALS Method · AI visibility snapshots
AI search visibility was measured, too.
The report compares rank snapshots across answer engines. These positions are not recommendations or guarantees, but they show where the brokerage was surfaced in the report’s selected queries.
Footnote: AI rank snapshots compare the report’s baseline audit on Nov 13, 2025 with its latest audit on Oct 11, 2026. Individual platforms independently determine whether and how a business appears.
GEMINI
#17 → #2
“best realtors in raleigh”
CHATGPT
#5 → #2
“sell my home in raleigh”
META AI
#3 → #2
“best realtors in raleigh”
GOALS Method · LSA Build & Management
A separate paid local-discovery channel with measurable lead volume.
SOURCE WINDOW
Oct 1, 2025 - Oct 1, 2026
The LSA build & management layer of the GOALS Method provides a separate 12-month snapshot of paid Local Services Ads delivery. These results are not combined with the Local Search Dominance figures above.
Total lead spend
$21,379.04
LSA dashboard total for the selected window.
Charged leads
255
213 phone leads · 42 message leads
Cost per charged lead
$83.84
Calculated from supplied spend and charged-lead totals.
Ad impressions
47,717
Times the ad appeared in search results during the selected date range.
Top impression rate on Search
95.99%
Reported share of impressions shown above unpaid results.
Absolute top impression rate
27.95%
Reported share of impressions shown as the very first ad in Search.
Separate prior GOALS Method case-study material
A 12-month client outcome
snapshot, kept distinct.
The supplied prior GOALS Method case-study material reports broader marketing outcomes over a separate 12-month period. Its dates are not shown in the supplied image, so these figures are presented independently and are not added to the Local Search or LSA results on this page.
$2.5M
reported commissions from leads
407
reported leads generated
136,820
reported site visits within 1 year
5×+
reported site traffic versus the year before
$21,525 reported ad spend over 12 months | 10×+ reported return | #1 in market share / sales volume across multiple towns
The brokerage takeaway
Build the presence. Track the movement. Handle the opportunity.
For broker-owners, growth does not have to be a black box. The GOALS Method connects ARIA, Local Search Dominance, and LSA build & management so you can strengthen the signals your brokerage controls and see where visibility, profile engagement, and paid local discovery are moving.
When that work is paired with a clearly measured paid local channel and a team that can follow up, your brand has more opportunities to be discovered and contacted in the markets you serve.
SOURCE NOTES
Built to keep the story honest.
Source note 1: GOALS Method: the combined Realty Forte program represented in this case study: ARIA, Local Search Dominance, and LSA build & management.
Source note 2: Local Search Dominance: Coldwell Banker Howard Perry and Walston report supplied by the client, covering Oct 8, 2025 - Oct 8, 2026. The heat-map and AI snapshot comparisons identify their own baseline and latest audit dates.
Source note 3: LSA Build & Management: supplied Local Services Ads dashboard screenshot covering Oct 1, 2025 - Oct 1, 2026.
Source note 4: Prior case-study material: supplied 12-month case-study screenshot; its specific date range is not shown in the image. It is not combined with the reports above.
Final disclaimer: Results are client-specific and historical. Realty Forte does not guarantee rankings, AI visibility, lead volume, revenue, listings, or transaction outcomes.
REALTY FORTE
a Division Of Hospitality Marketing Inc.
24 Stewart Place (Back Unit) Fanwood, NJ 07023


